


Surface O3 (MDA8)
DATASET DESCRIPTION
GlobalHighO3, supplied by Dr. Jing Wei, provides UK estimates of maximum daily 8-hour average (MDA8) surface ozone for 2000–2021. The source resolution is 10 km, and the original concentration unit is ppb. The project documentation reports resampling to 1 km and conversion of pollutant units to μg/m³ as needed. The UK maps use μg/m³ on that basis; the conversion procedure is not specified.
GlobalHighO3 belongs to the GlobalHighAirPollutants collection, which uses artificial intelligence to estimate ground-level pollution and its spatial and temporal variation. Its official Zenodo record identifies the ozone metric as MDA8. The provider describes the GlobalHighO3 manuscript as in preparation. The two related papers listed below concern China and do not provide UK-specific validation.
Each daily GeoTIFF records the maximum of that day’s 8-hour averages. Annual maps were calculated in R by averaging the available daily MDA8 values at each grid cell, omitting missing values. This statistic is an annual mean of daily maxima, not a 24-hour mean or an annual maximum. The 1 km grid retains the information limits of the 10 km source.
Yang, Z., Li, Z., Cheng, F., Lv, Q., Li, K., Zhang, T., Zhou, Y., Zhao, B., Xue, W., Wei (2025) Two-decade surface ozone (O3) pollution in China: Enhanced fine-scale estimations and environmental health implications. Remote Sensing of Environment, 317, 114459. https://doi.org/10.1016/j.rse.2024.114459.
DATA SOURCE
| Data Sources: GlobalHighO3, Version 1. doi.org/10.5281/zenodo.10208188 |
| Geographic Coverage: United Kingdom |
| Coordinate System: OSGB36 / British National Grid (inspected UK sample) |
| Source Spatial Resolution: 10 km; project grid: 1 km (resampled) |
| Data Preparation Date: September 2026 |
| Data Format: GeoTIFF |
| Sampling Frequency of Data: Daily |
| Years Available: 2000–2021 |
VARIABLES
- Maximum daily 8-hour average (MDA8) O3 concentration and its annual mean (μg/m³, per project documentation)
CONTACT
- UK Dataset Prepared By: Bocheng Zhu
- Email: bocheng.zhu@mail.utoronto.ca
- Affiliated Organization: Ge-iSEE Lab, University of Toronto, Ontario, Canada
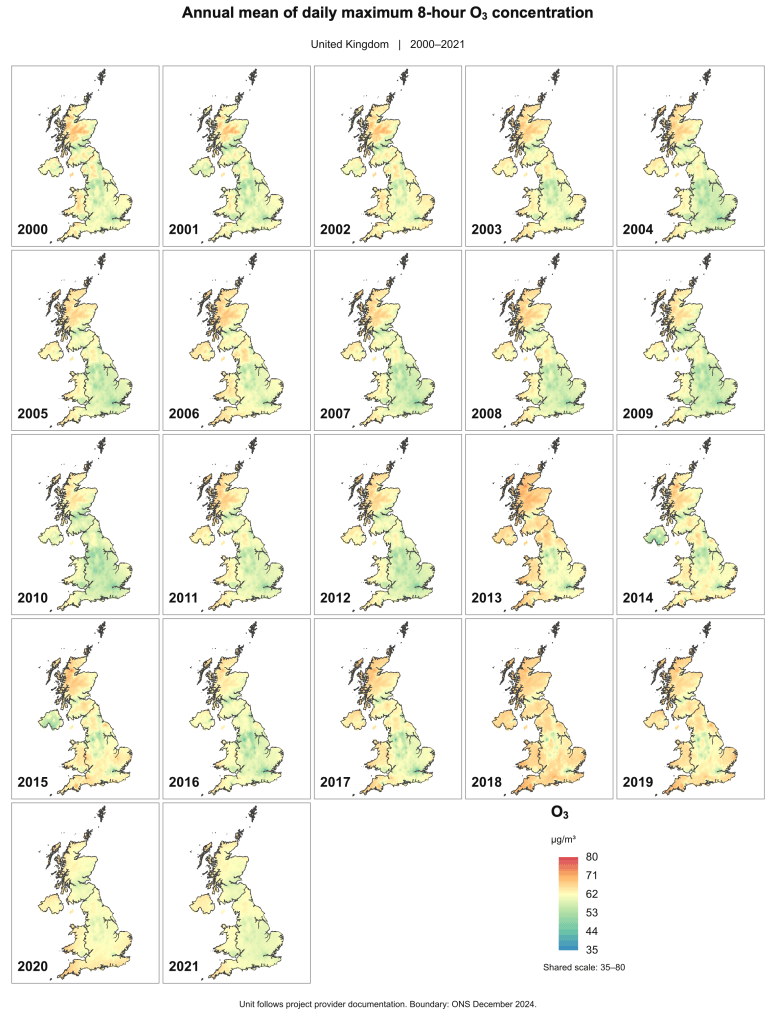
Figure 1. UK annual mean of daily maximum 8-hour O3 concentration (μg/m³), 2000–2021. All years use the same 35–80 colour scale. Colours indicate concentration, not health-risk categories.

