
Estimated Travel Time to the Nearest Forest by Driving
DATASET DESCRIPTION
The dataset on travel times for the nearest forest by driving is created by considering landscape constrains and a travel scenario that defines the travel speeds for each land cover class.
The variables used for travel time estimates include:
Ontario Digital Elevation Model (raster): describes the topography of the province’s terrain, as it influences the speed of travel depending on the scenario’s modes of travel. It’s altitude values and displayed in meters.
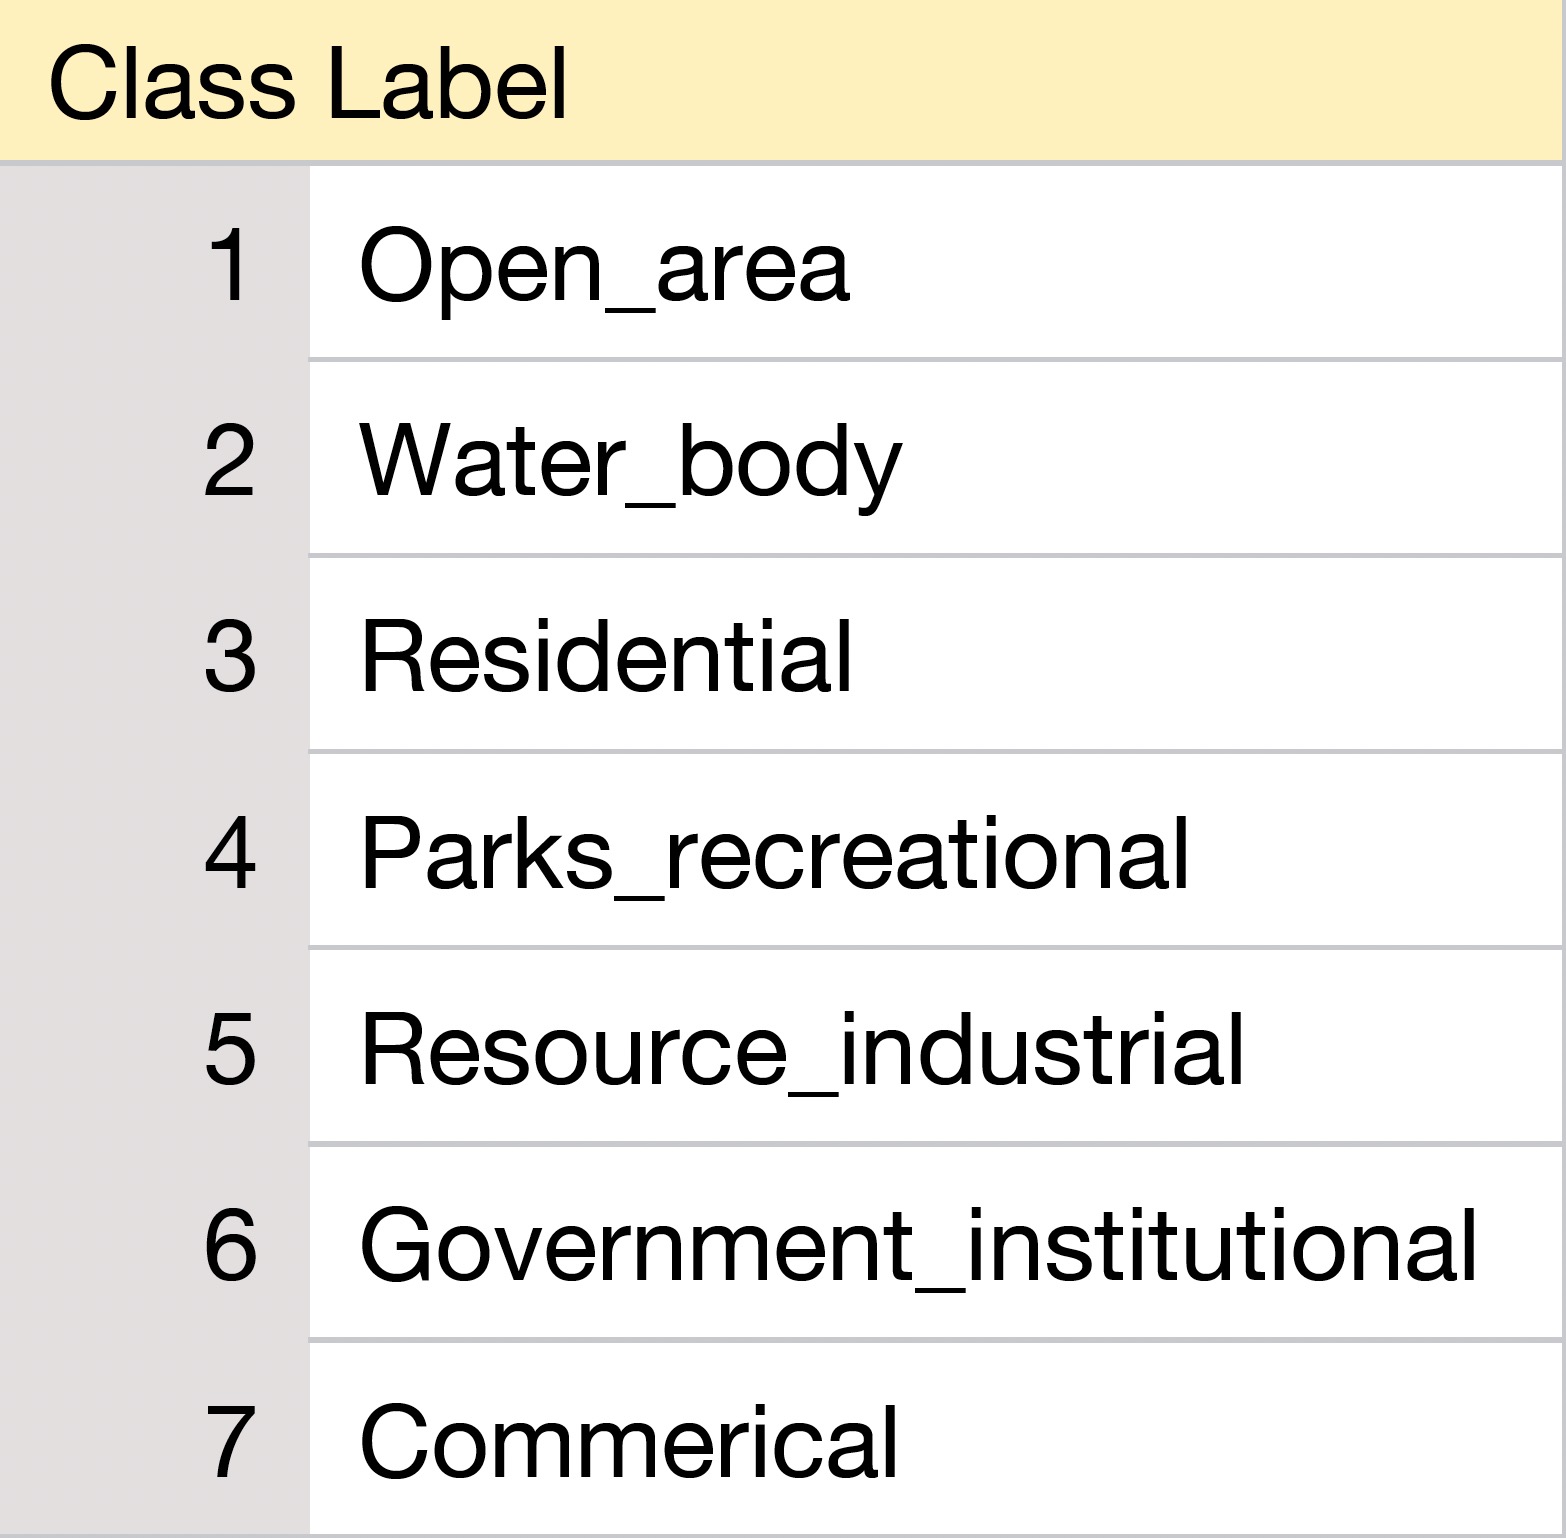
Ontario Land Cover (raster): a land cover distribution grid containing broad land cover types and their spatial arrangements. Each cell is identified as a Class ID number corresponding to one of seven possible types:
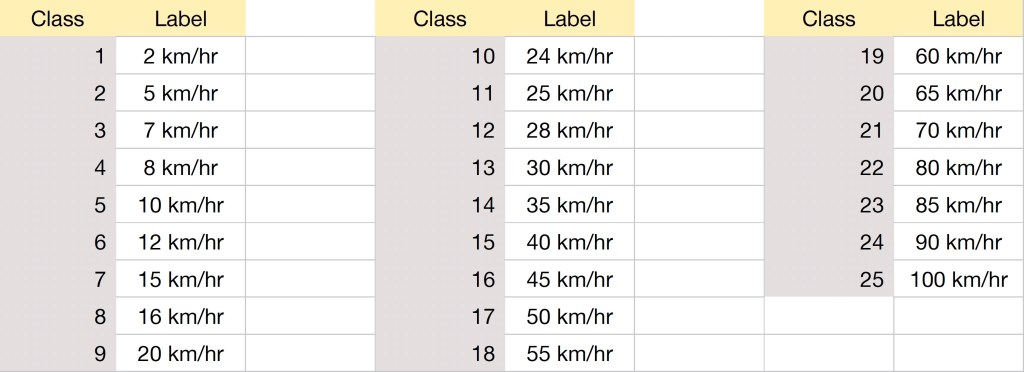
Ontario Road Network (vector): dataset encapsulating Ontario’s entire street network, including their respective speed limits. Depending on the speed, the analysis tool will increase the catchment area of each park. Each of the 574,386 streets in the vector file is identified with a Speed ID number associating with one of 25 possible speed limits:
Ontario Rivers (vector): dataset encapsulating all rivers in Ontario. The lines are interpreted by as barriers impeding individual movement.
Ontario Lakes (vector): dataset encapsulating all the lakes in Ontario. The polygons are interpreted as barriers impeding individual movement.
The datasets above are obtained from the Ontario Ministry of National Resources and Forestry (OMNRF) and Geospatial Ontario. The data are updated annually and processed using ArcGIS.
Parameters included in models for travel time estimates are included:
Merged Land Cover, Road network, river and lake datasets. Each cell’s value is associated either with a Land Cover Class, a Road Speed Class or Barrier marker.
Maximum Travel Time: Maximum travel time (in minutes) after which the analysis will stop computing access to neighboring targeted areas.
- The analysis runs a scenario with a limit of 60 minus for access to the nearest park by walking.
- The analysis runs a scenario with a limit of 90 minus for access to the nearest park by bicycling.
- The analysis runs a scenario with a limit of 120 minus for access to the nearest park by driving.
- The analysis runs a scenario with a limit of 240 minus for access to the nearest forest by driving.
Scenarios Table: defines travel speed and mode of transportation (WALKING, BICYCLING, or MORTORIED) for Land Cover and Road Speed Classes.

The parameters above are incorporated into geospatial models for travel time estimates using AccessMod v5 (https://www.accessmod.org).
DATA SOURCE
| Data Sources: 41.7 – 56.9N, 74.3-95.2W |
| Coordinate System: GCS North American 1983 |
| Geographic Project System: NAD 1983 UTM Zone 17N |
| Spatial Resolution: 250 meters |
| Data Preparation Date: September 2024 |
| Data Format: in GeoTiff |
| Sampling Frequency of Data: Annually |
| Years Available: 2005 to 2021 |
VARIABLES
- Annual travel time estimates to the nearest forest by driving (mins)
- Postal codes
CONTACT
- Dataset Creator: Xin Liu
- Email: liuxin@zucc.edu.cn
- Affiliated Organization: Ge-iSEE Lab, University of Toronto, Ontario, Canada

